
An Excel add-in that runs forward selection, backward elimination and stepwise regression, then writes a report in the same layout as Excel's Data Analysis > Regression tool. It works in Excel for Windows, Mac and the web, and needs no macros.
Install from the Office Add-ins store
- In Excel, go to Home > Add-ins (or Insert > Get Add-ins).
- Search for Stepwise Regression and click Add.
- A Stepwise Regression button appears on the Home tab.
Install from the add-in file
Use this before the store listing is live, or if the store is unavailable.
Download the add-in file HOUMBA-28-Stepwise-Regression.xml
Excel for the web
- Open a workbook at office.com.
- Open Add-ins: in a wide window it is at the right end of the Home ribbon. In a narrow window, click the ⋯ at the right end of the Home ribbon, or use Insert > Add-ins.
- Click More Add-ins (or Advanced), open the My Add-ins tab, then click Upload My Add-in.
- Click Browse, choose the downloaded
HOUMBA-28-Stepwise-Regression.xml, and click Upload. - A Stepwise Regression button appears on the Home tab.
If Upload My Add-in is missing or greyed out, your school or work account may block custom add-ins. Sign in with a personal Microsoft account instead. Uploaded add-ins are remembered per browser, so upload again on a new browser or computer.
Excel for Mac
- Quit Excel.
- In Finder, press Cmd+Shift+G and go to
~/Library/Containers/com.microsoft.Excel/Data/Documents/wef(create theweffolder if it is missing). - Copy
HOUMBA-28-Stepwise-Regression.xmlinto that folder and reopen Excel. The add-in is under Home > Add-ins > My Add-ins.
Excel for Windows
Go to Home > Add-ins > More Add-ins > My Add-ins. If Upload My Add-in is shown, use it as above. If not, use Excel for the web or install from the store.
Use it
- Click Stepwise Regression on the Home tab.
- Select the Y column and click Use selection, then do the same for the X columns.
- Choose the method and criterion and click Run regression. The report opens on a new sheet.
Try it with sample data
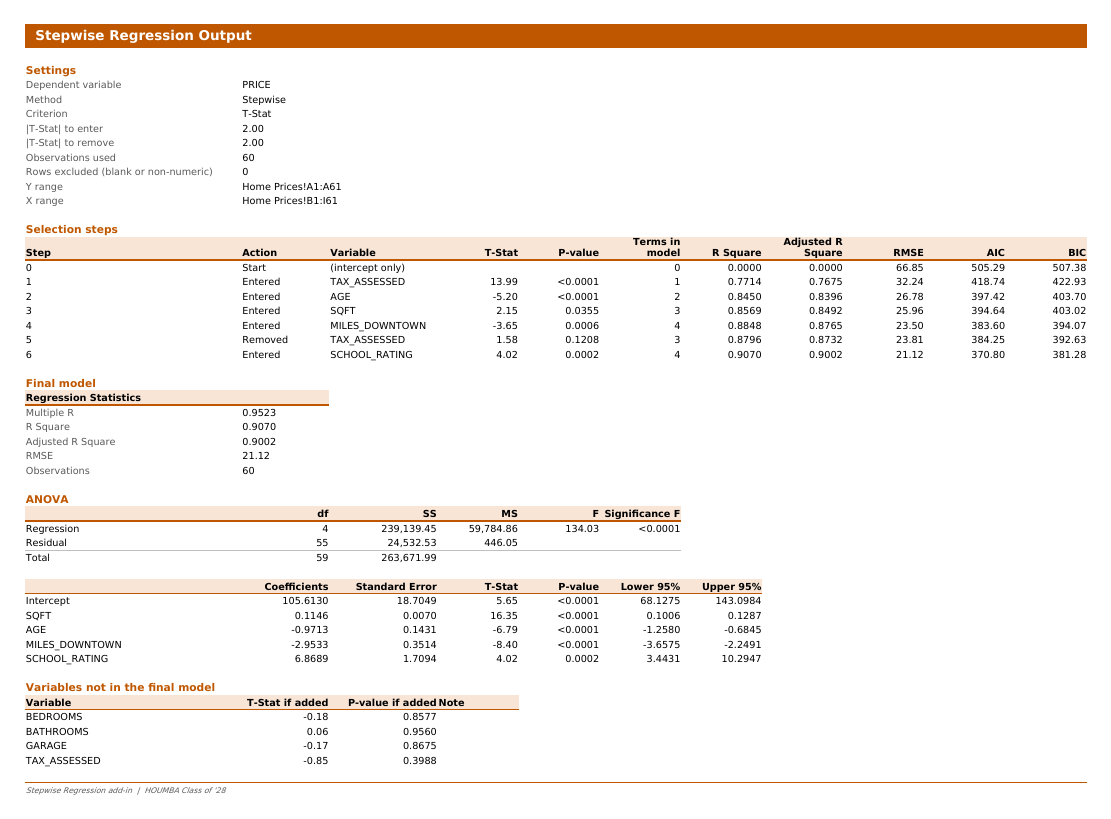
Download home-prices.xlsx: 60 fictional home sales with eight candidate predictors. On the Home Prices sheet, use Y A1:A61 and X B1:I61, then run Forward, Backward and Stepwise and compare the selection steps. The Read Me sheet explains what to look for.
Desktop macro version
Prefer a macro (VBA) version for desktop Excel on Windows or Mac? It produces the same report and adds a =STEPREG() worksheet function, but needs macros enabled. Download and setup steps are in the VBA folder on GitHub. Most people should use the add-in file above instead.